Pre-K Funding Shiny App
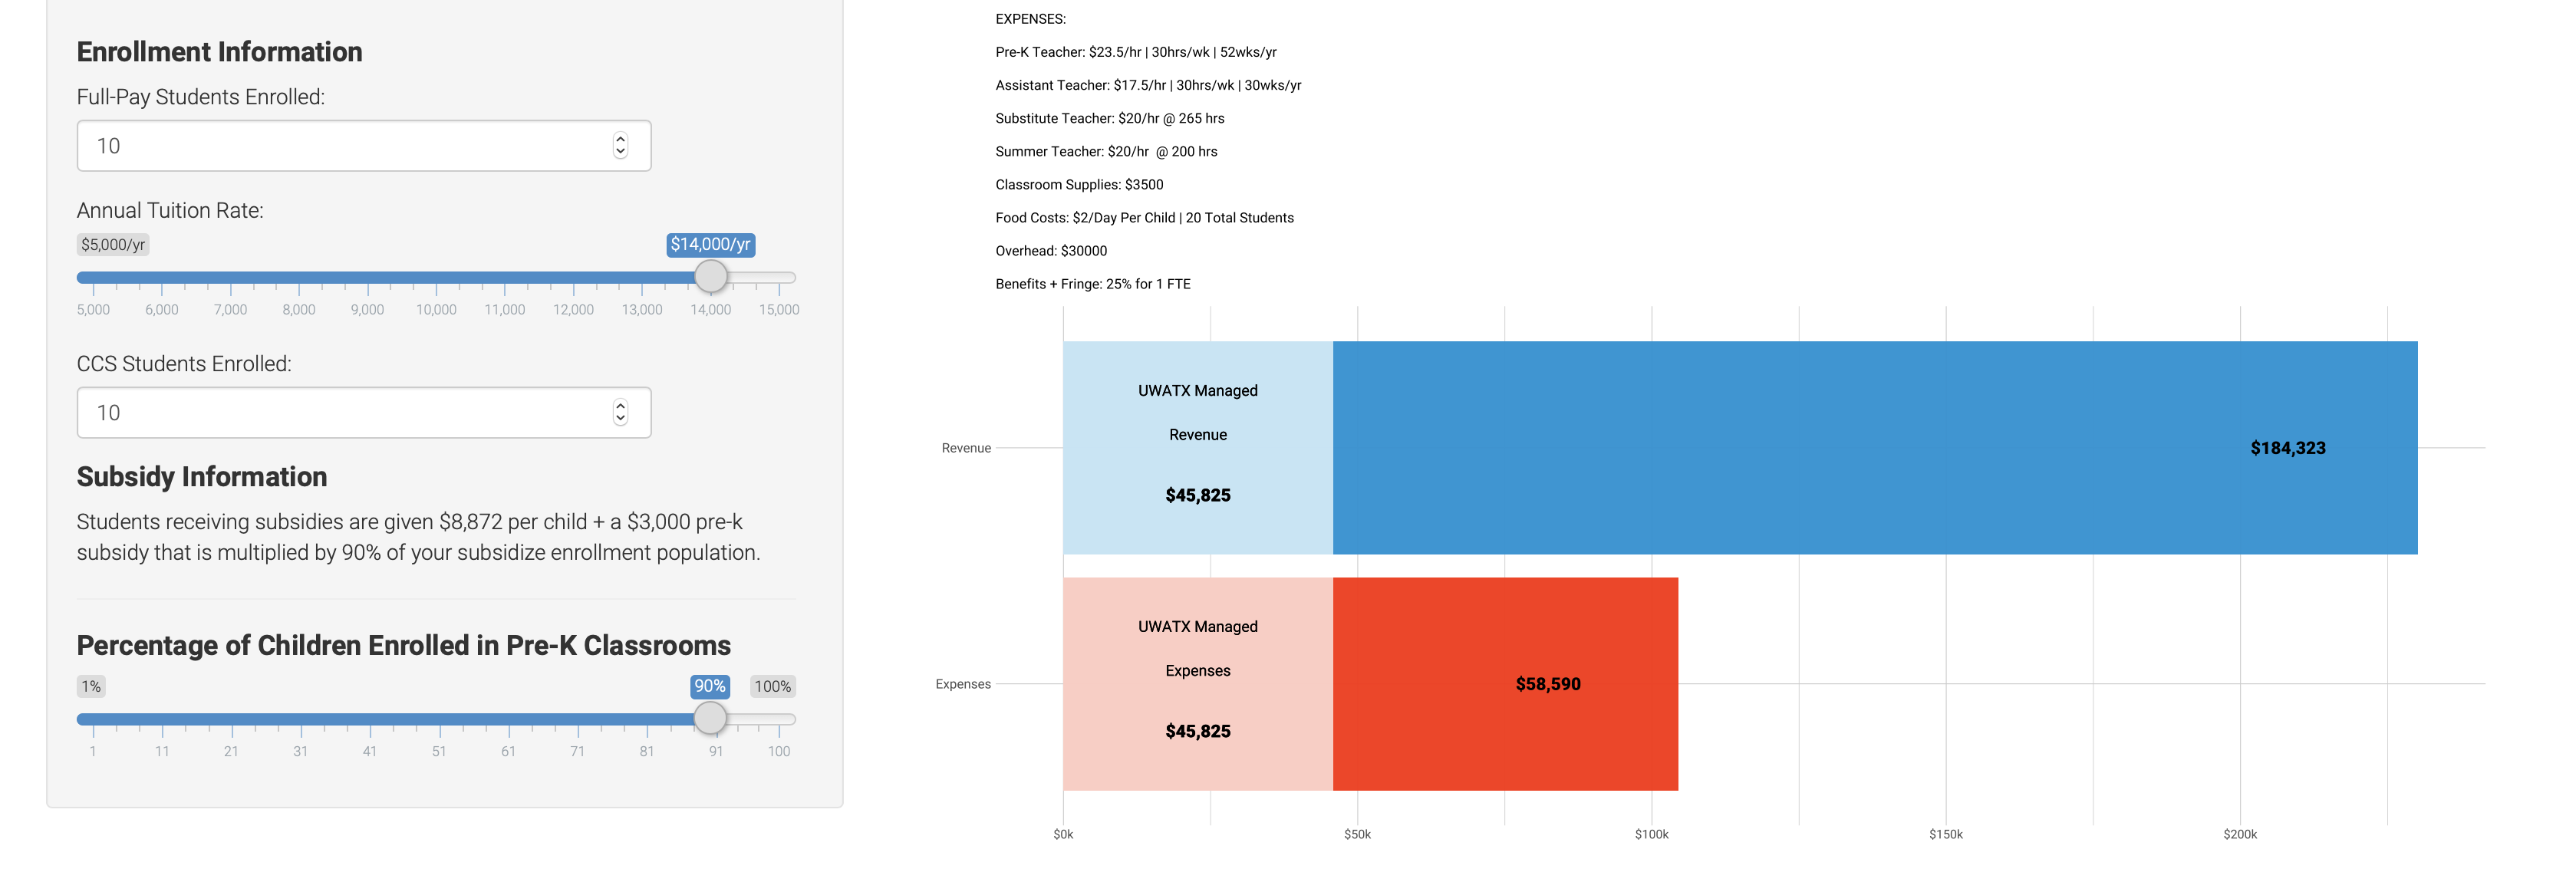
Built in R with shiny and ggplot2, this app was used to model partnerships that could expand pre-kiindergarten seats in central Texas.
As an analytics professional with an extensive background working in public schools and the nonprofit sector, I spend a significant amount of time and energy solving problems that benefit the public using data science tools---from increasing the accessibility of publicly available data to developing models that distill complex policies into human-friendly graphics. Check out some of my favorite projects below and holler if you would like my help.

Built in R with shiny and ggplot2, this app was used to model partnerships that could expand pre-kiindergarten seats in central Texas.

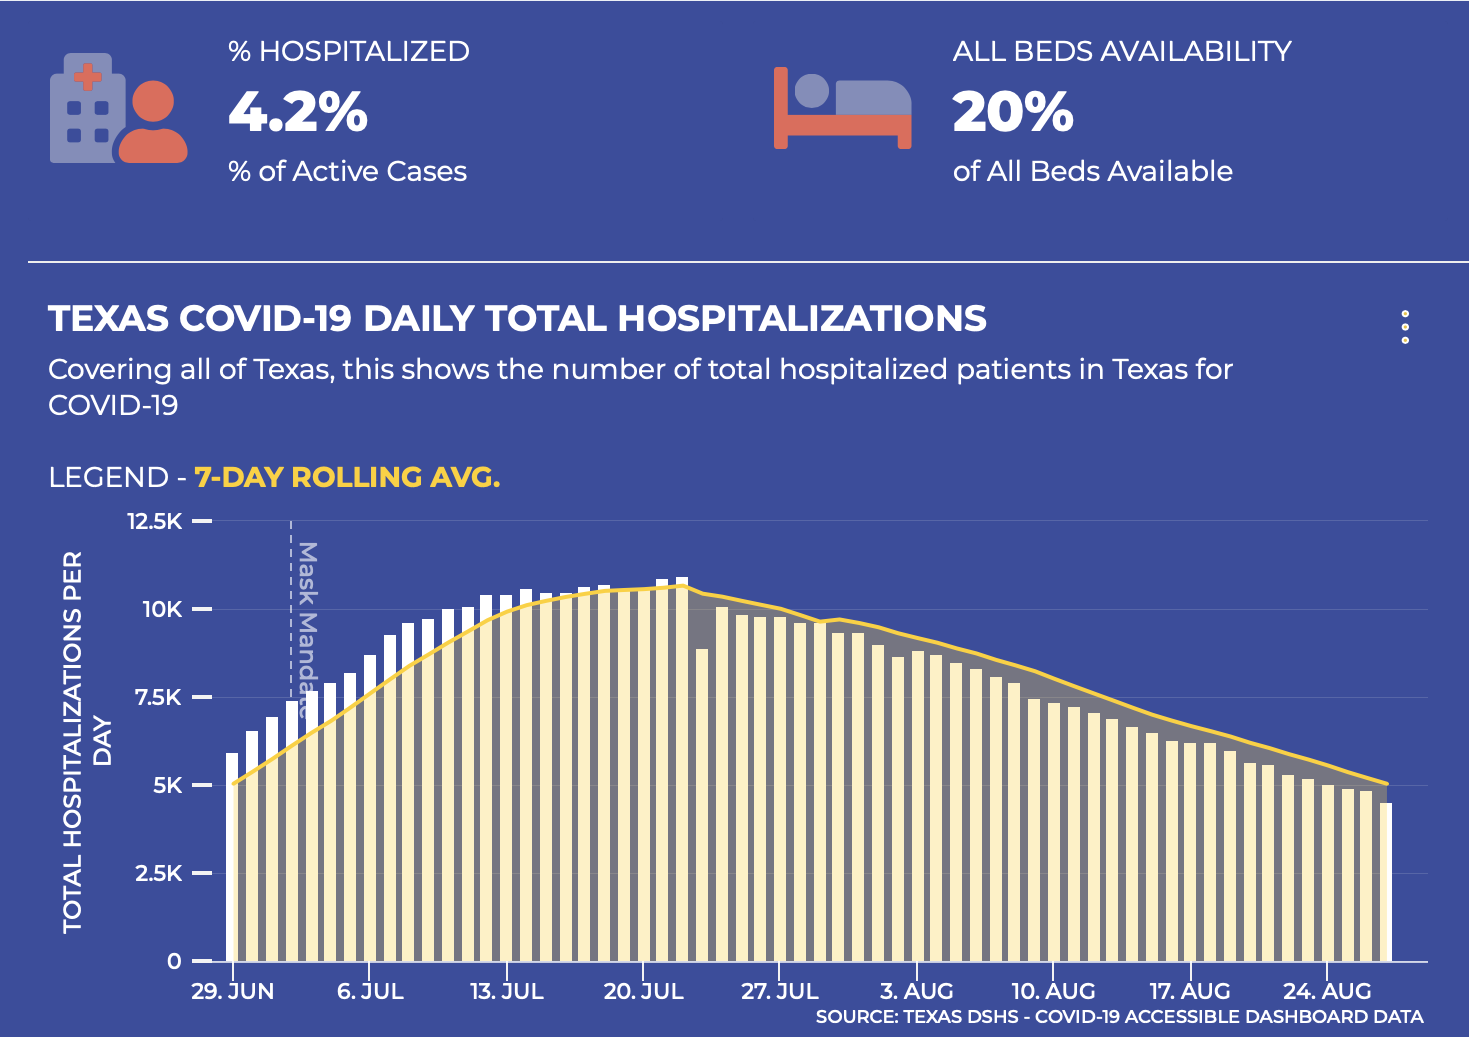
Built in R with shiny and highcharter, this app tracks COVID-19's toll taken on the lives of Texans and the deep economic hardships endured across Texas.

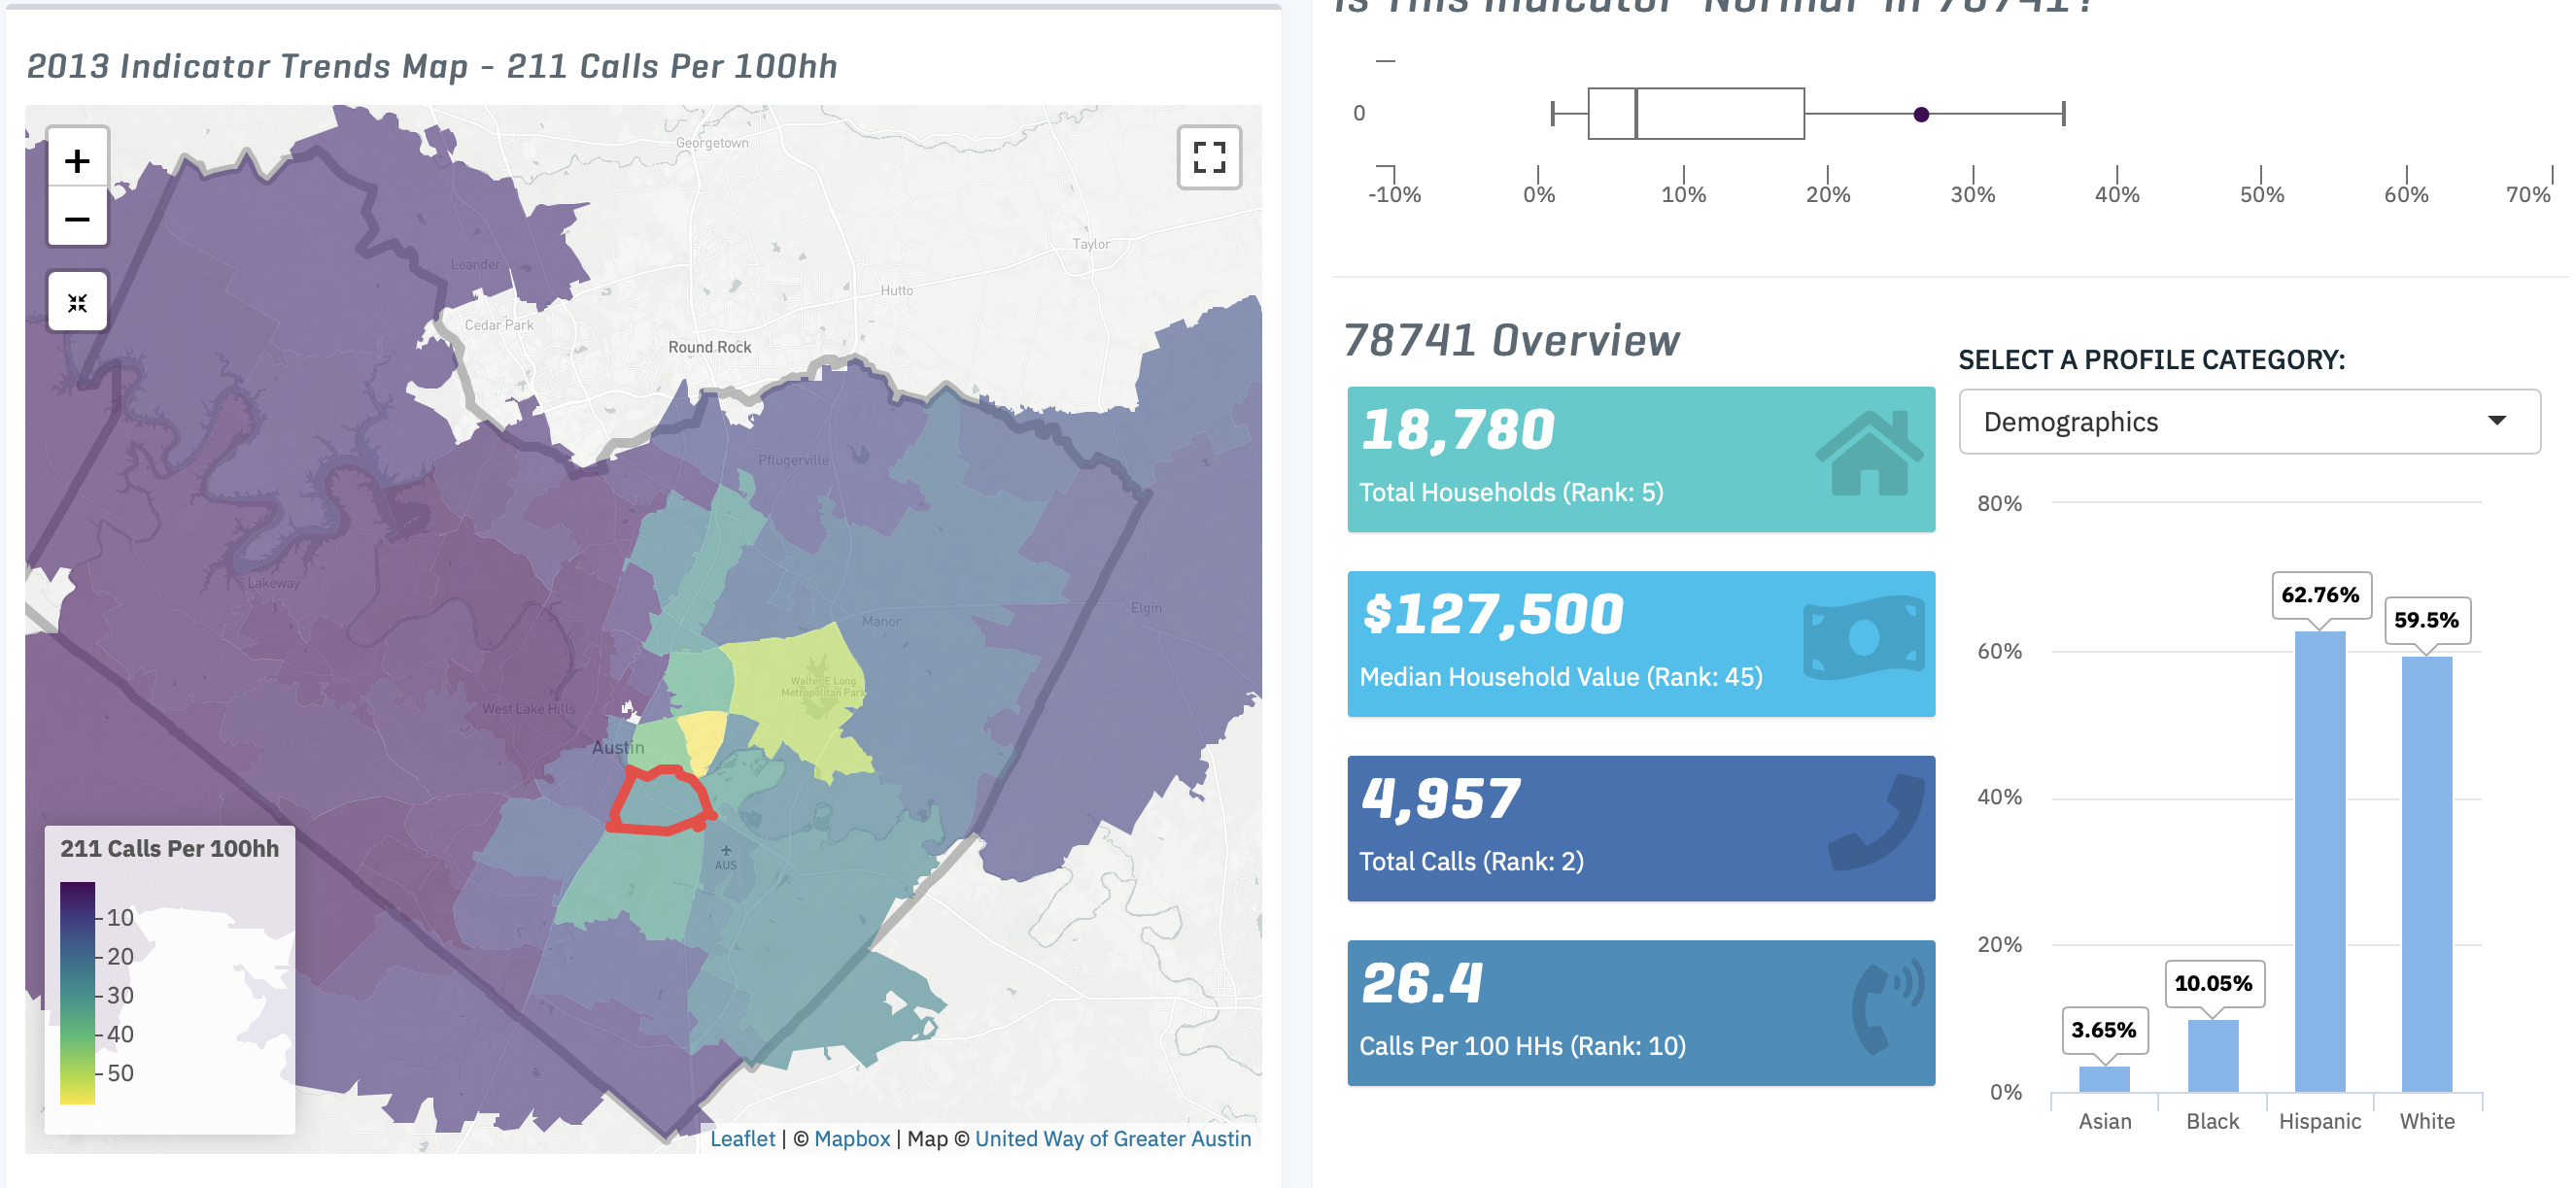
Built largely in R with shiny, shinydashboard, highcharter, and leaflet, this project allowed United Way to explore 211 caller data.

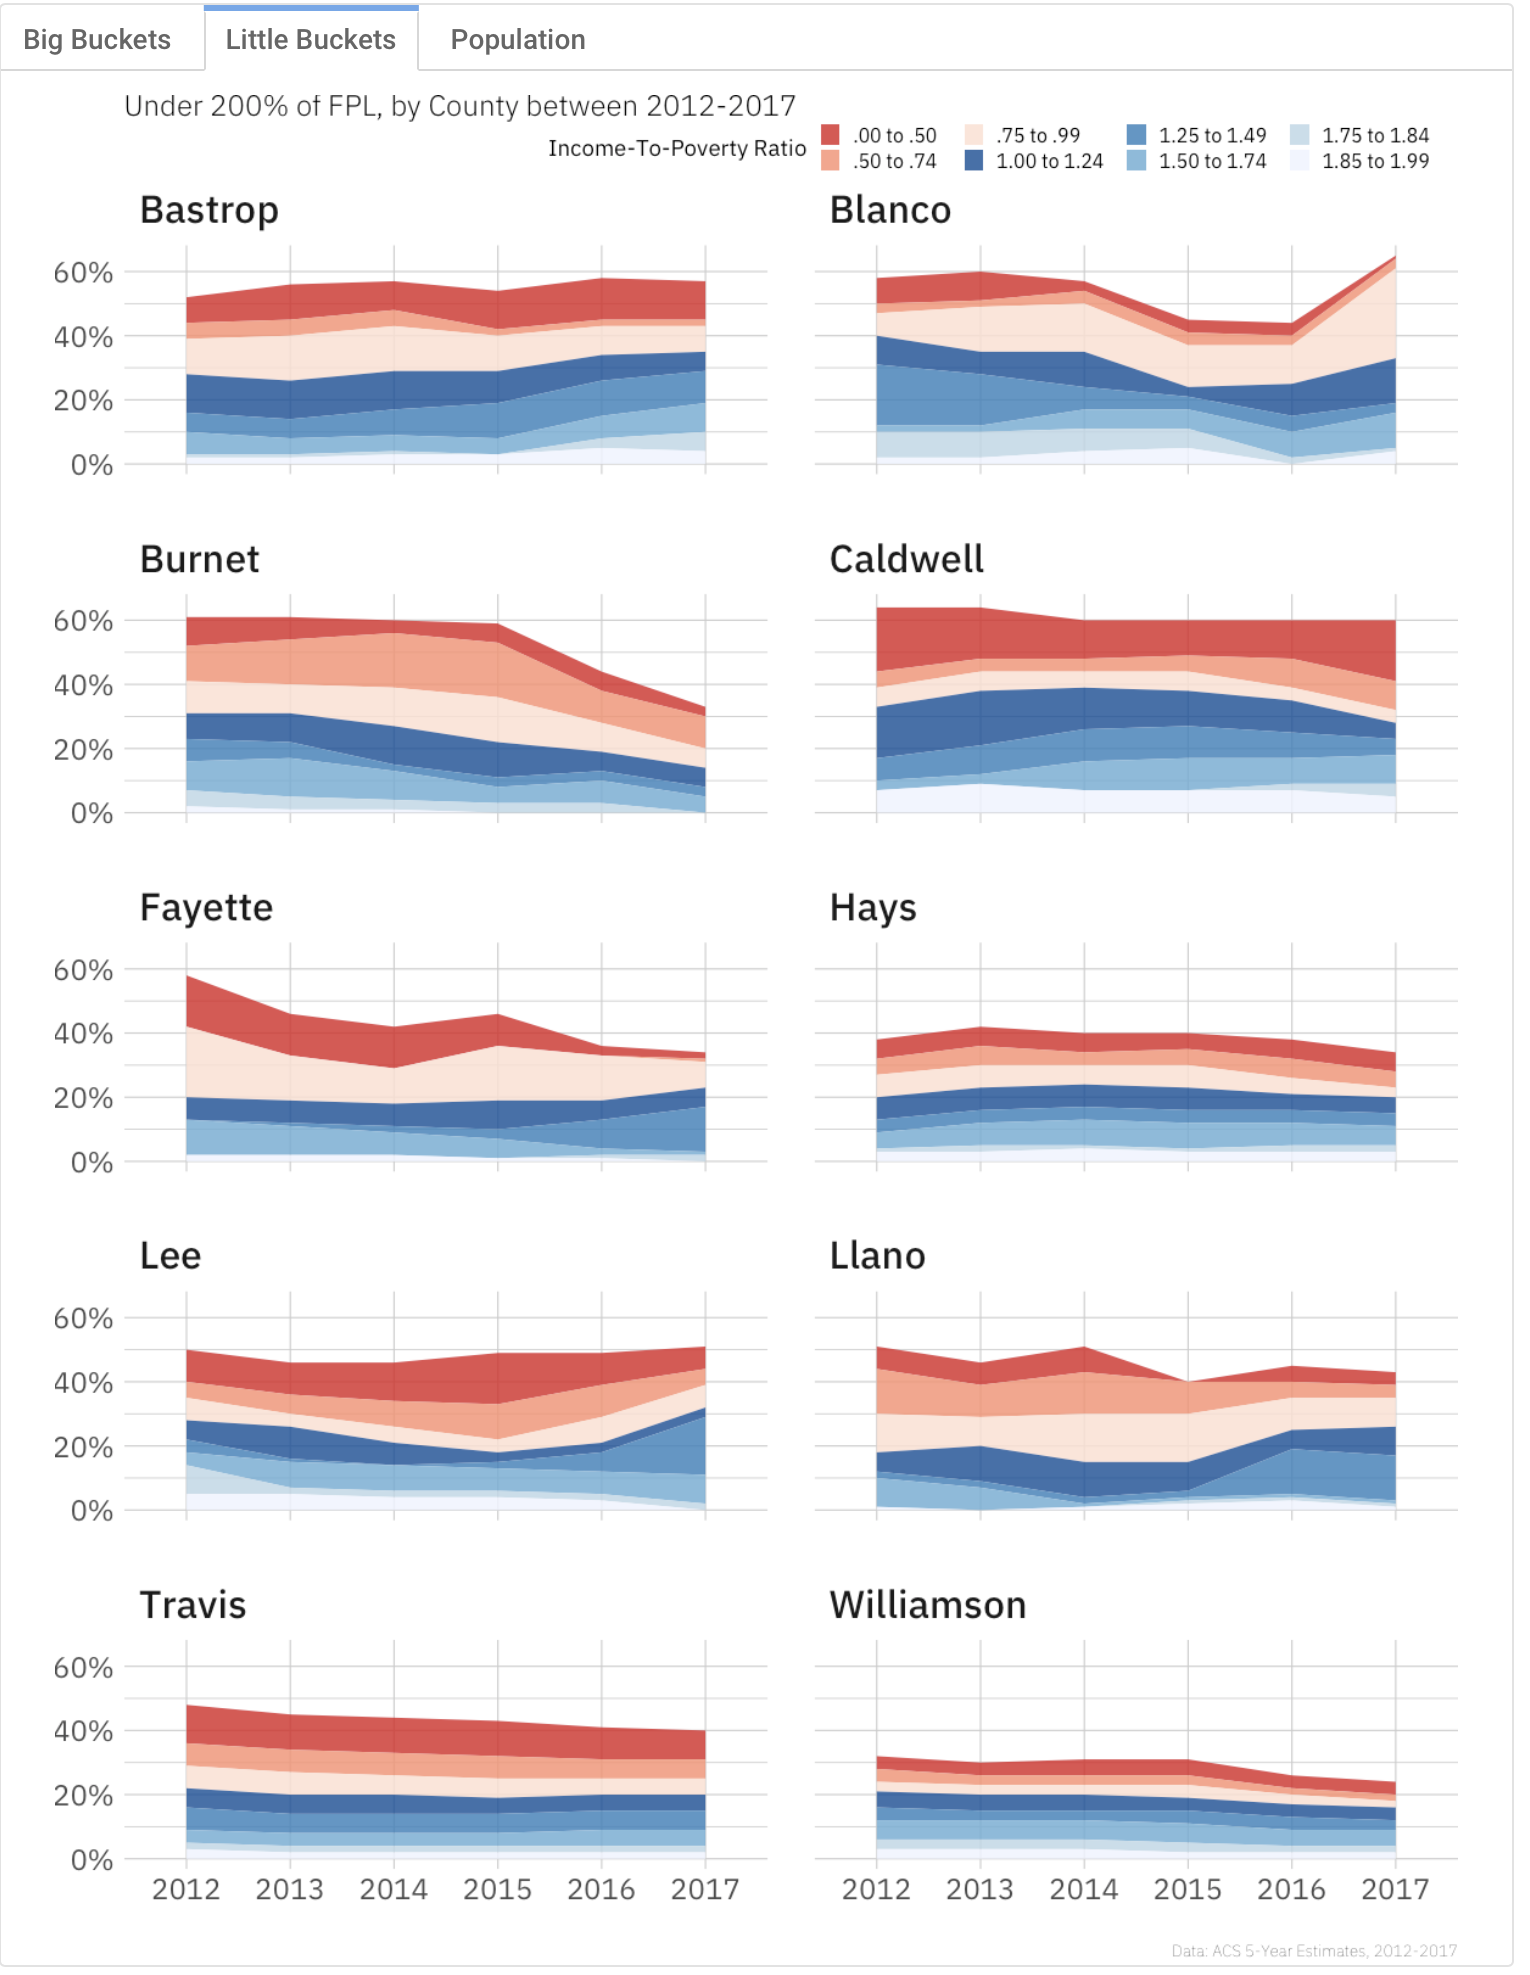
Built in R, this project was used flexdashboard, tidycensus, purrr, and ggplot2 to build out a comprehensive look at childhood poverty over time among the Capital Area Council of Government counties.